The plotly Package
Reference
Installation
pip install plotlyUsage

More Examples

Further Exploration
Last updated
pip install plotly

Last updated
# adapted from: https://plot.ly/python/getting-started/#initialization-for-offline-plotting

import plotly
import plotly.graph_objs as go

plotly.offline.plot({
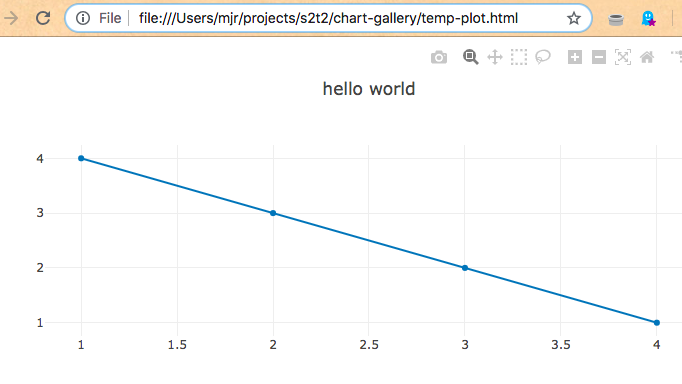
    "data": [go.Scatter(x=[1, 2, 3, 4], y=[4, 3, 2, 1])],
    "layout": go.Layout(title="hello world")
}, auto_open=True)# adapted from: https://plot.ly/python/pie-charts/
import plotly
import plotly.graph_objs as go
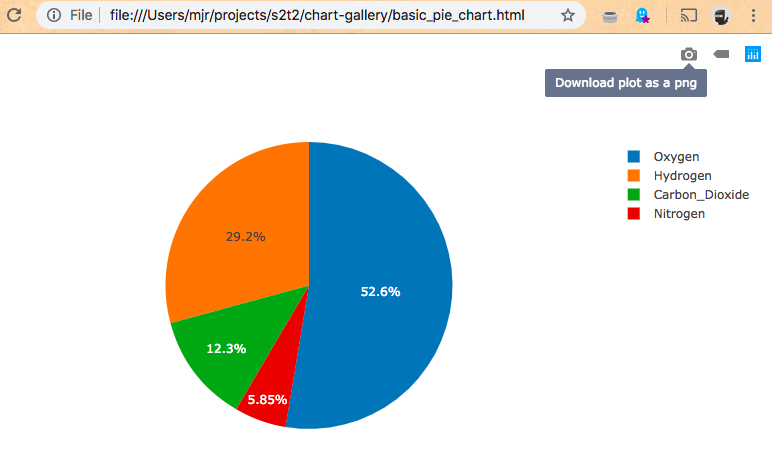
labels = ["Oxygen", "Hydrogen", "Carbon_Dioxide", "Nitrogen"]
values = [4500, 2500, 1053, 500]
trace = go.Pie(labels=labels, values=values)
plotly.offline.plot([trace], filename="basic_pie_chart.html", auto_open=True)