Processes
Computer-based information systems enable or facilitate some set of defined processes or procedures.
Process Analysis
The act of describing a process in writing usually leads to a better understanding of that process.
Process Diagramming
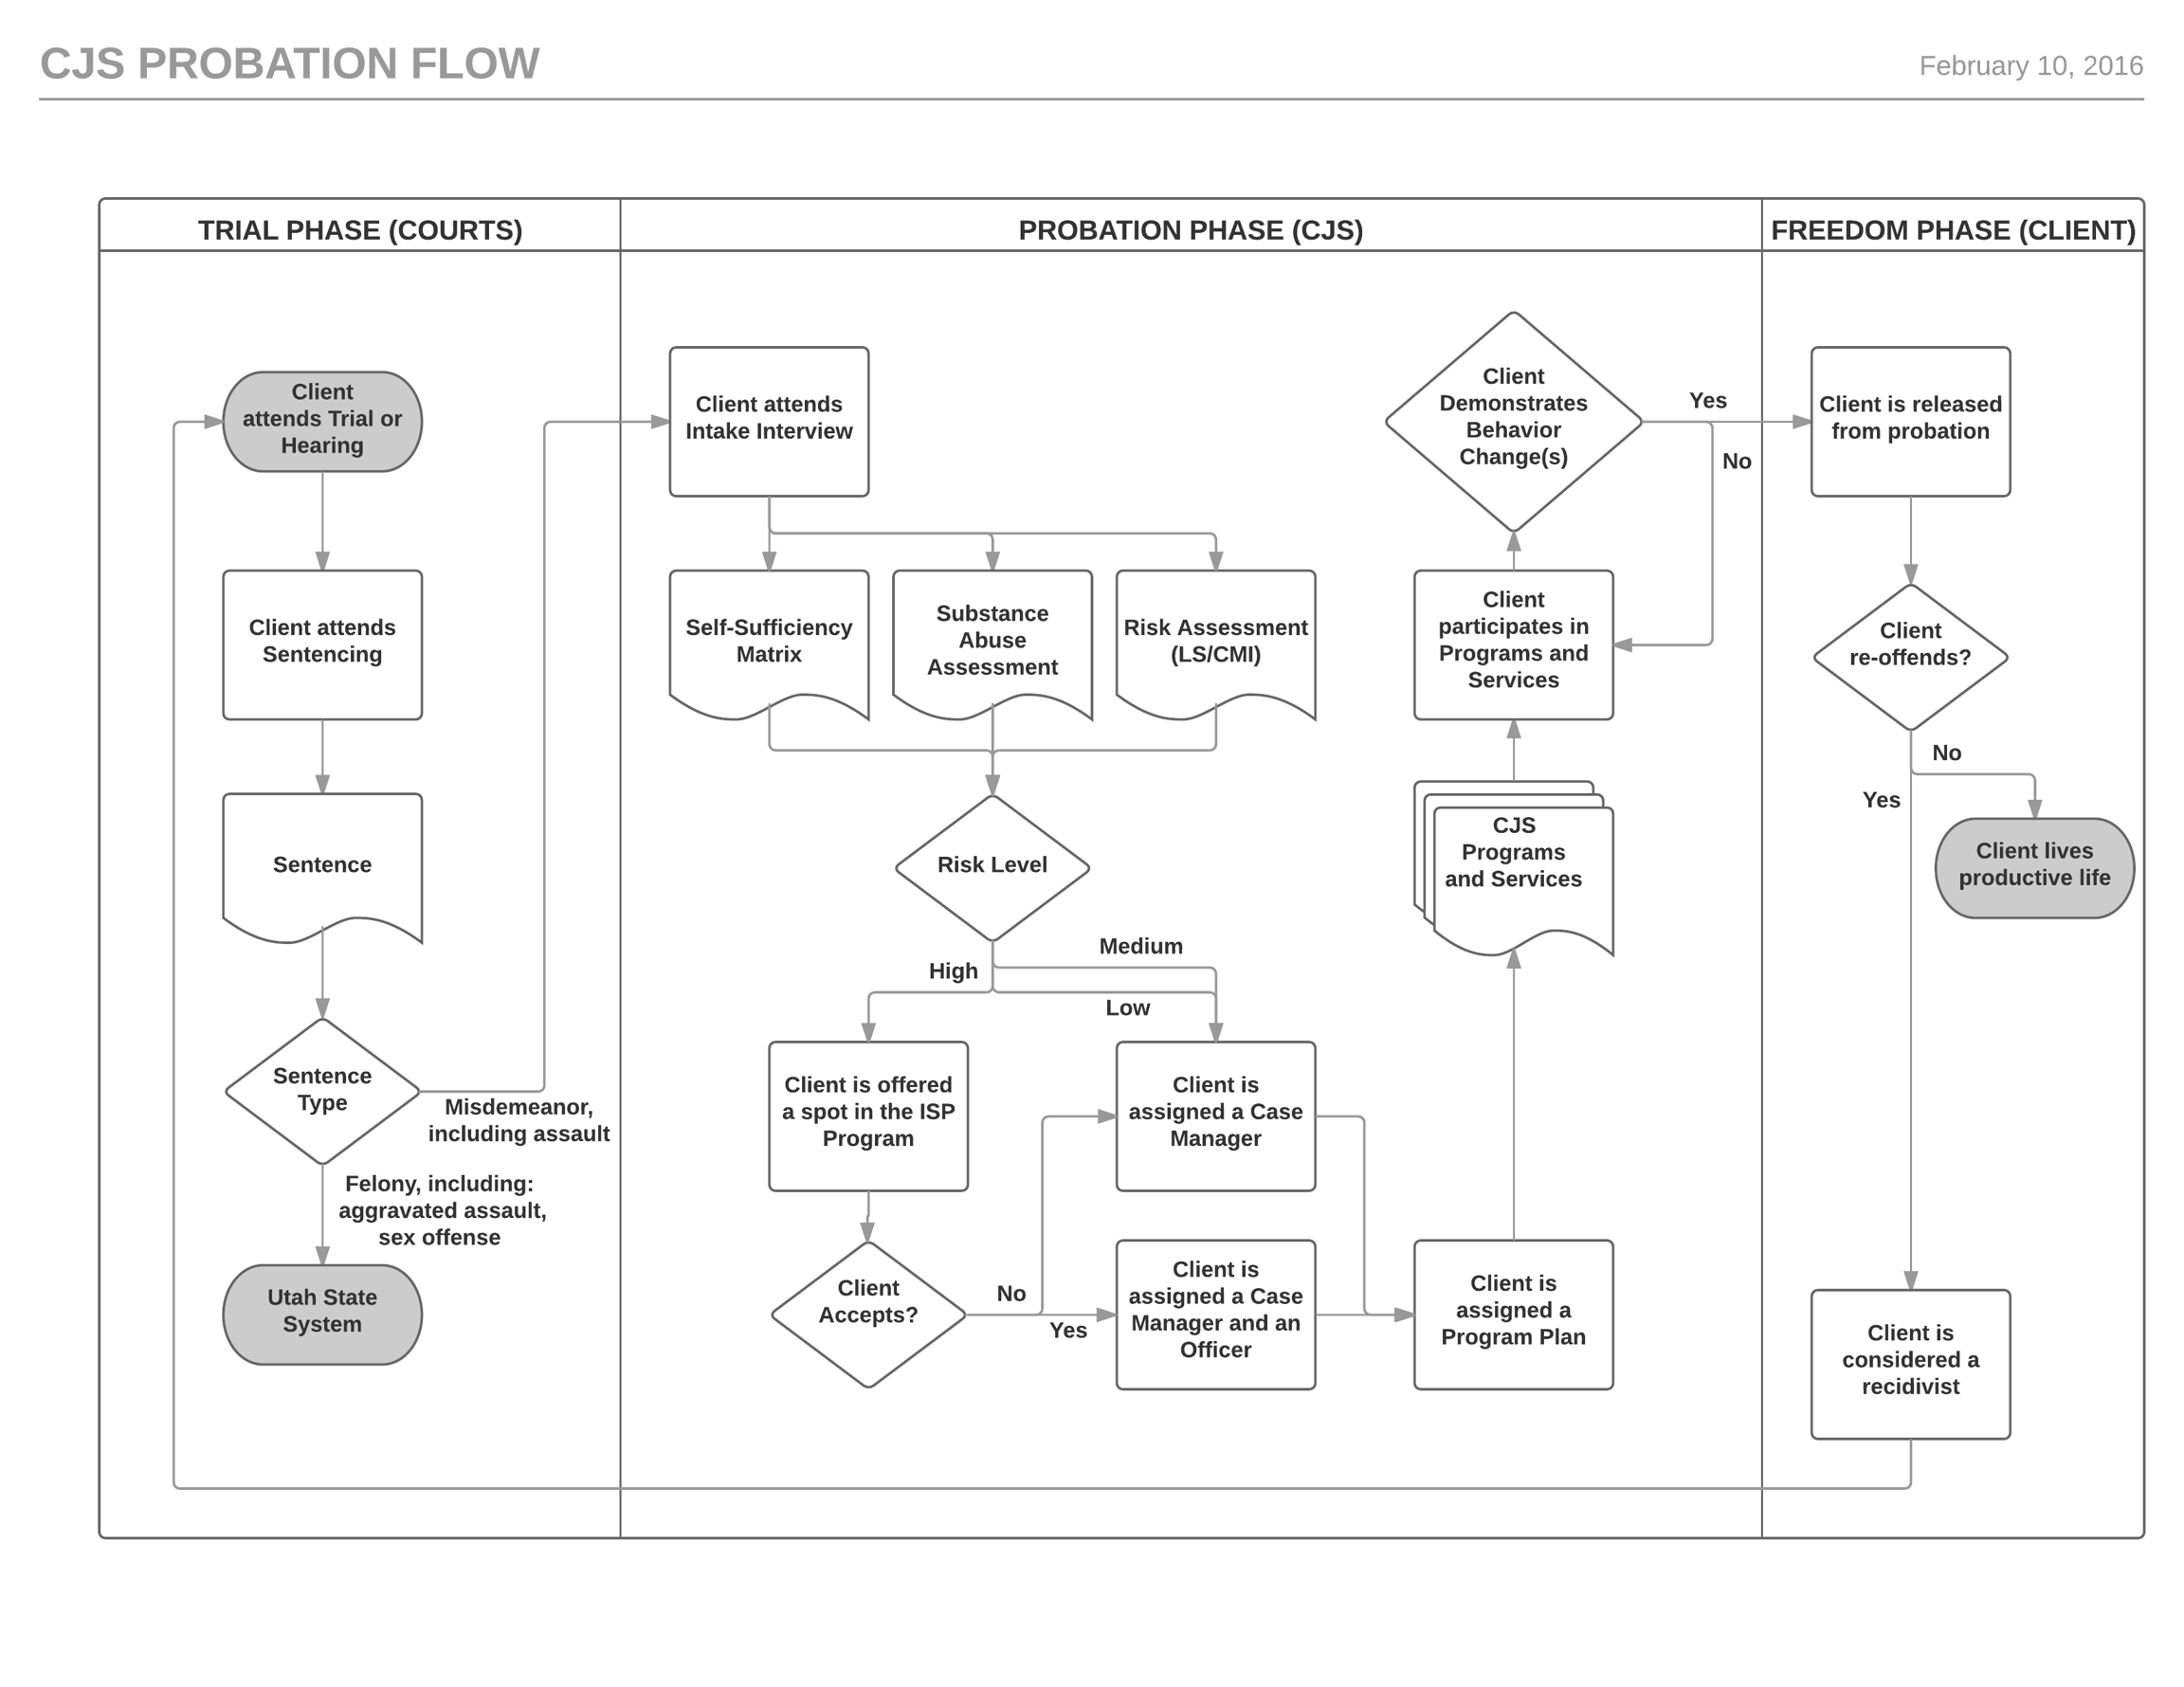
One good way of demonstrating and communicating your understanding of a process is by diagramming it.
Process Diagrams depict the flow and scope of a process from start to finish. Process diagrams should ideally be accompanied by written descriptions of the various component sub-processes.
Process Diagramming Tools
Tools with diagramming capabilities:
Word Processing Software (e.g. Google Docs, MS Word)
Presentation Software (e.g. Google Slides, MS PowerPoint)
LucidChart (recommended)
Process Diagram Shapes
Process diagrams generally employ a standard set of shapes, each with a specific meaning:
shape
purpose
Circle or Oval
A "terminator" which indicates the start or end steps of the process
Square or Rectangle
A sub-process, or step in the overall process
line with an arrow
Points from one step to another to indicate sequential flow, including sub-process dependencies
Diamond
Denotes a "decision-point" in the process, including conditions under which different outcomes are possible
Square with a squiggly bottom
A "document" produced by, or related to, a step in the process
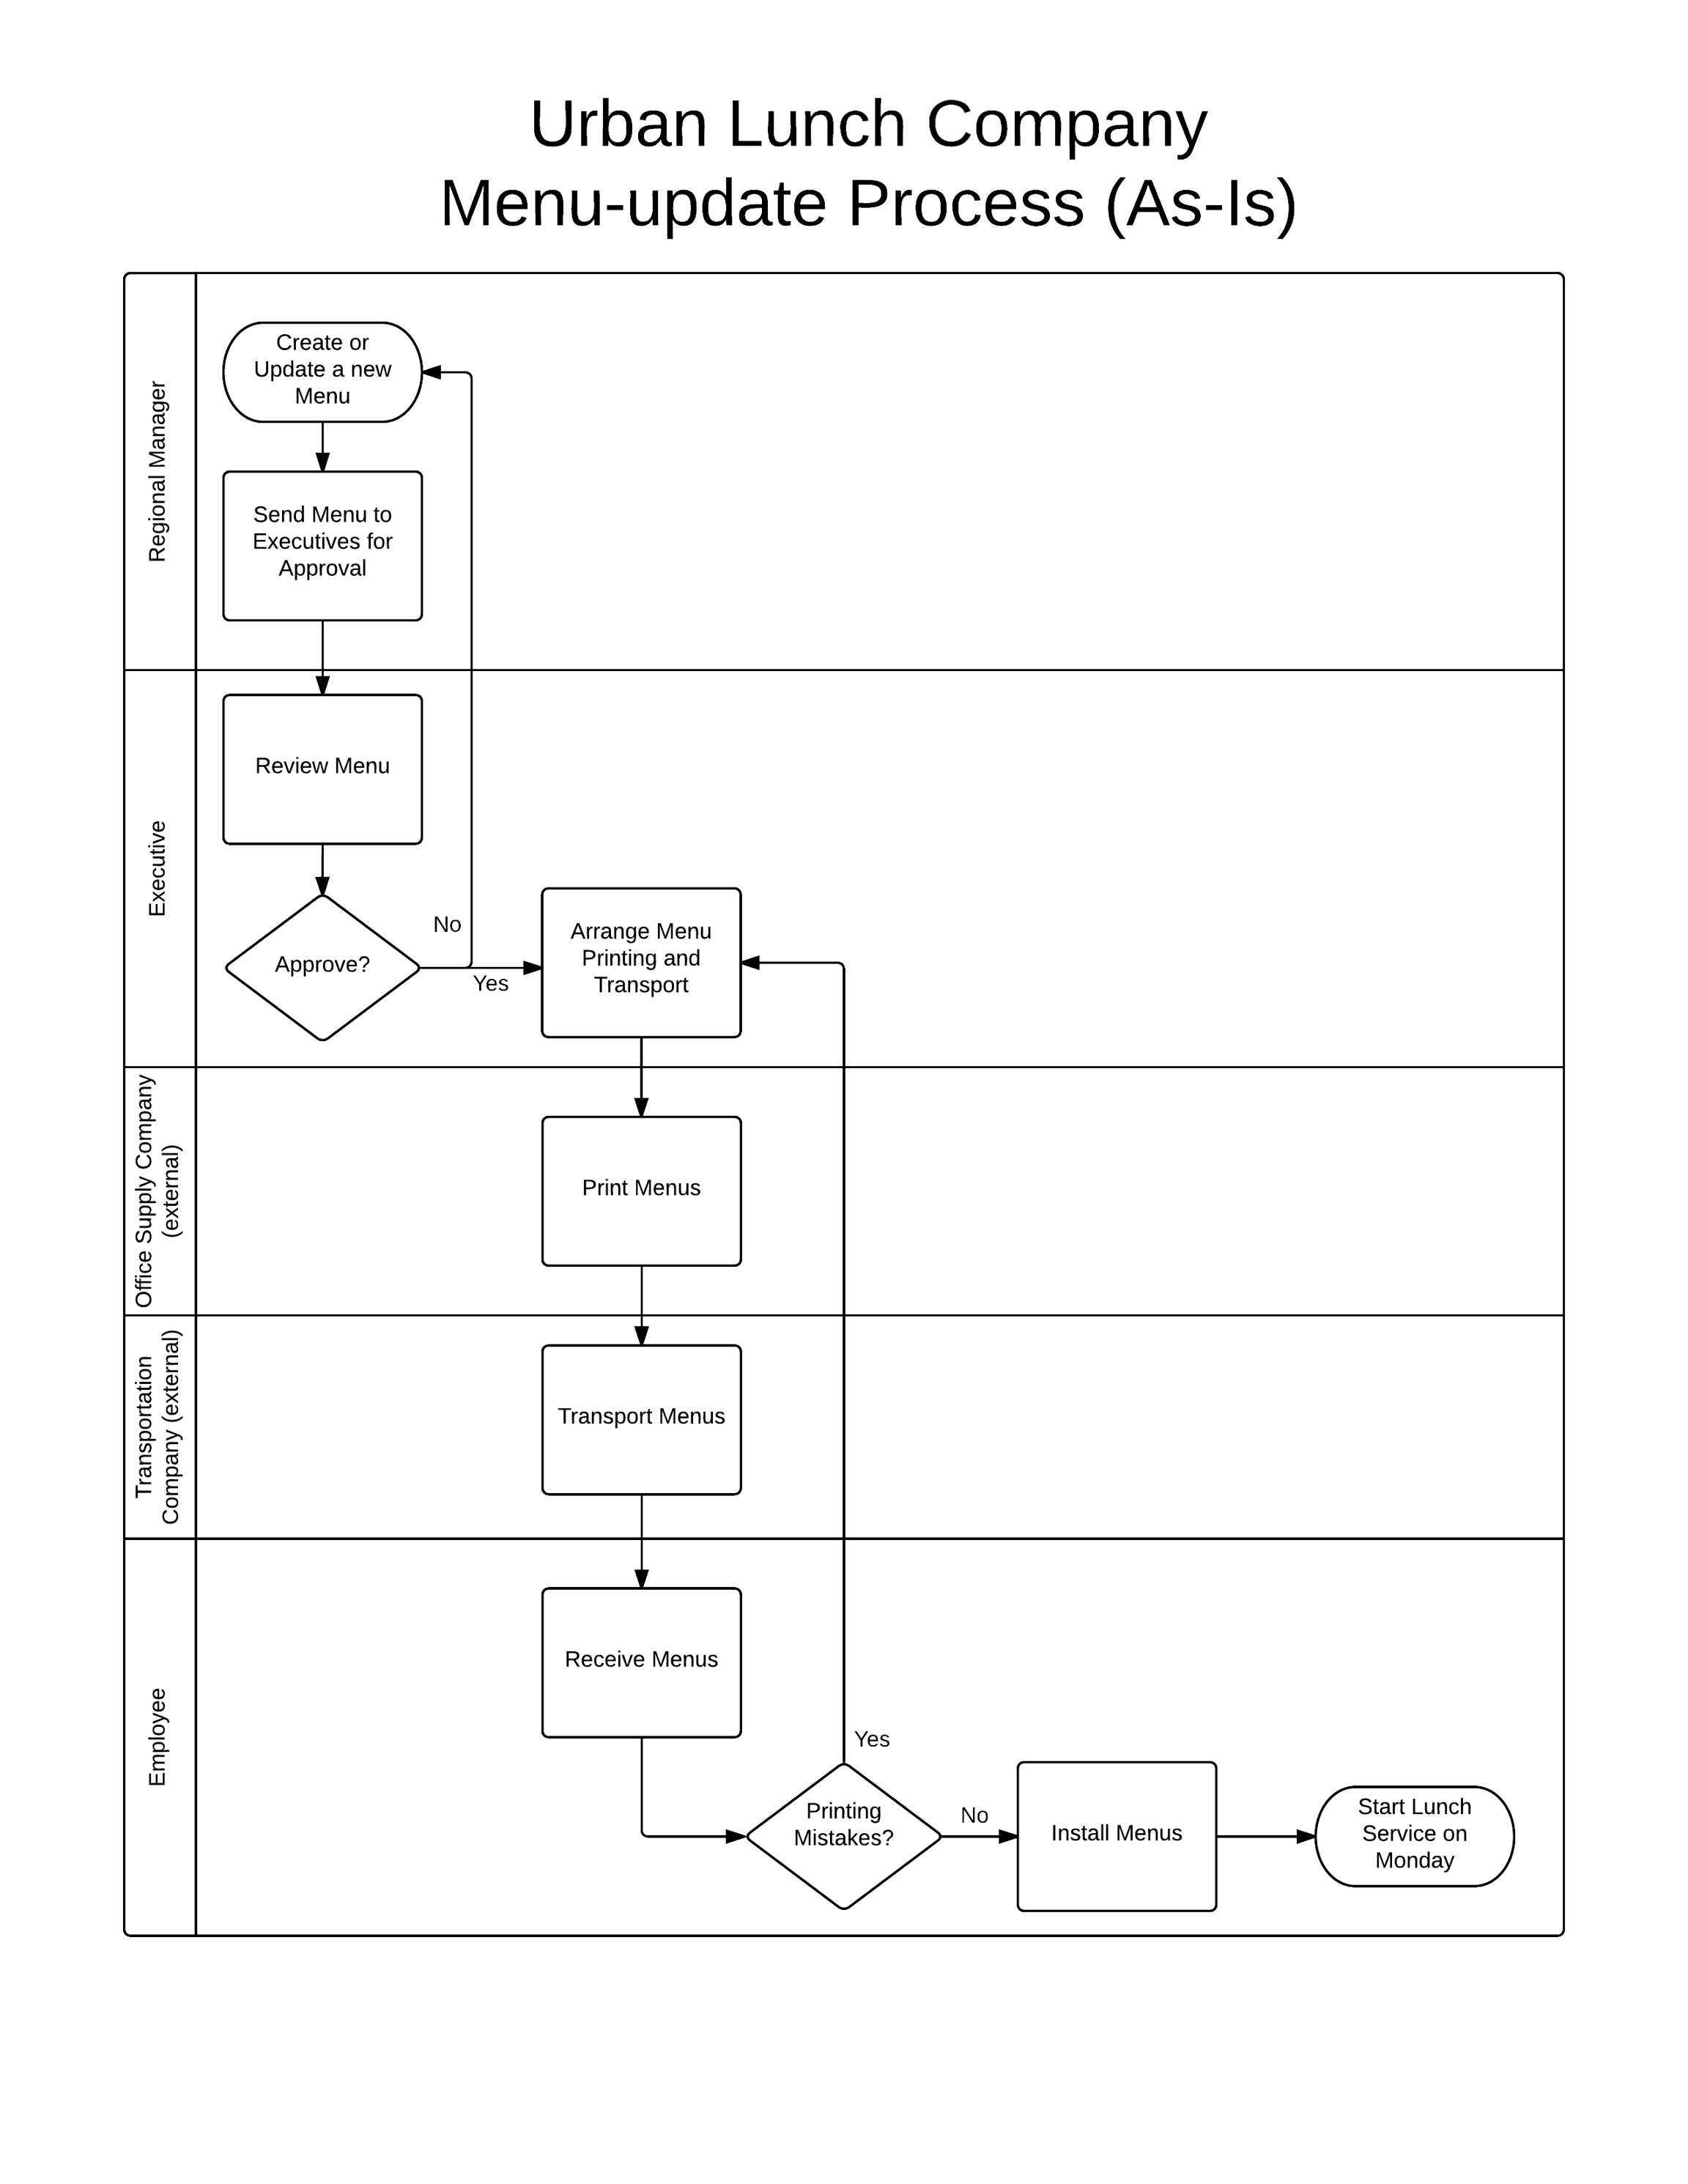
Additionally, some process diagrams use visual separators called "swim lanes" to indicate which stakeholders are responsible for each sub-process.
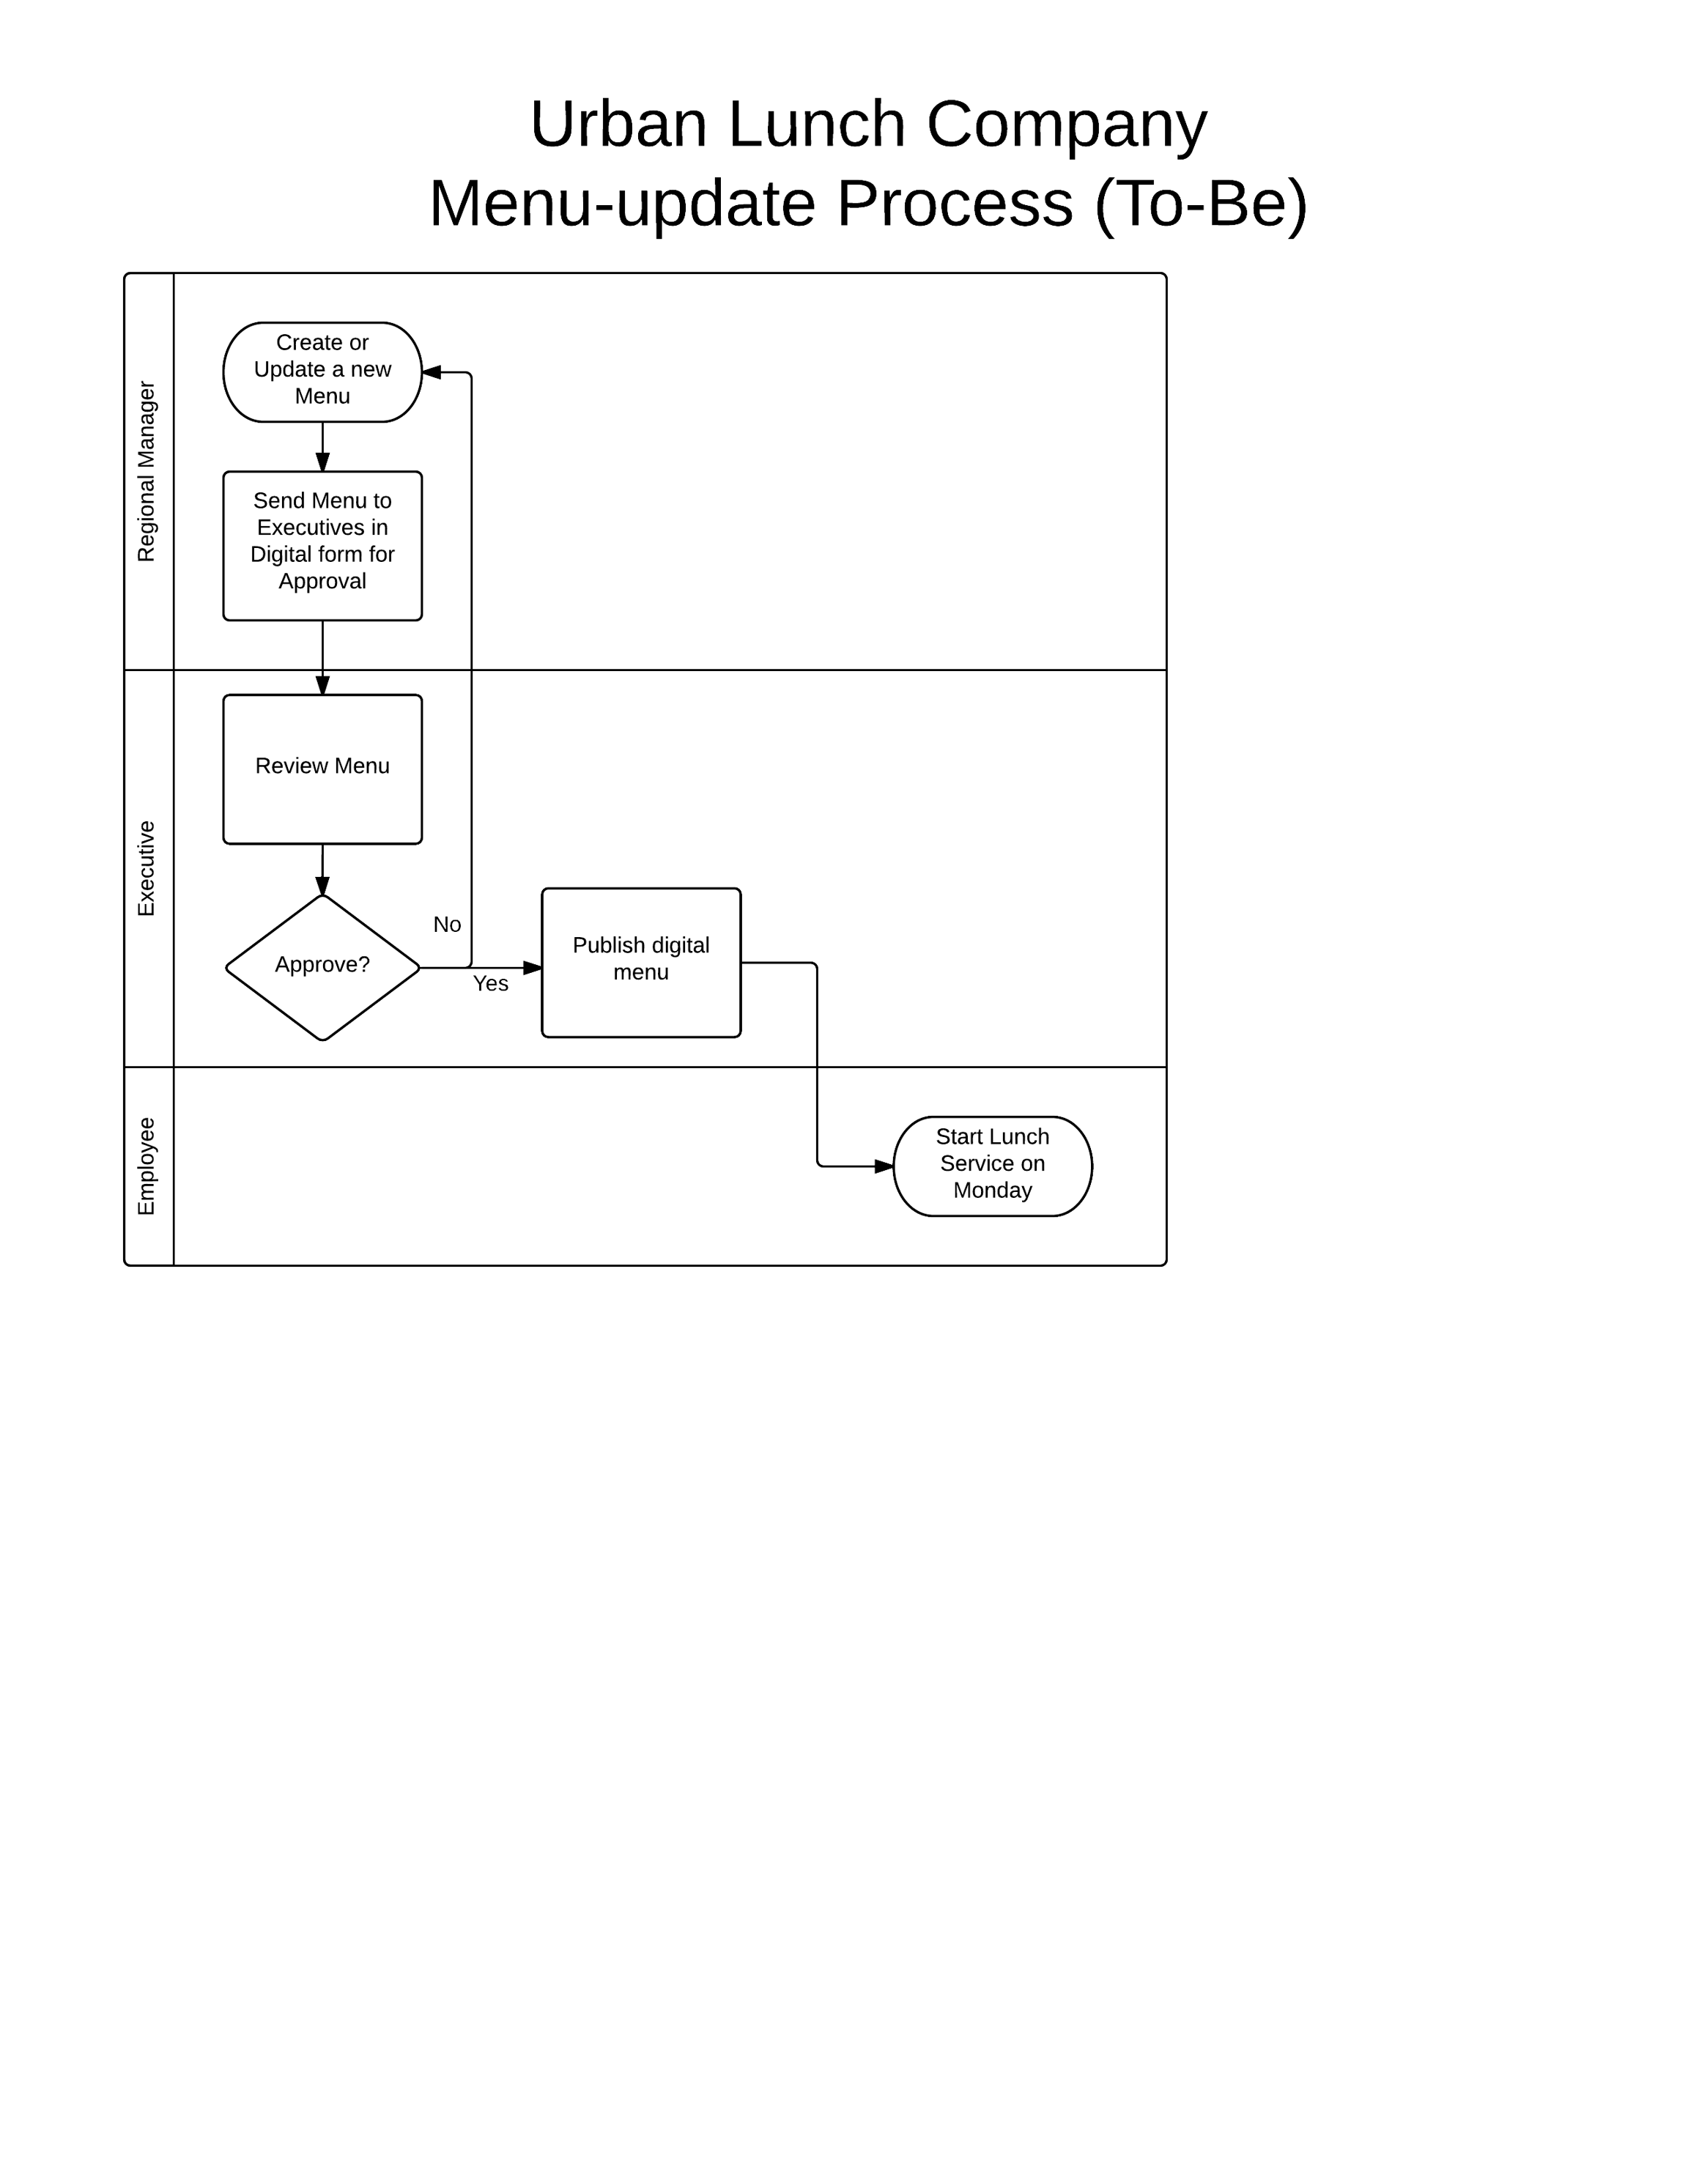
Process Re-engineering
After learning more about the process, analysts are able to identify "pain points", or areas in need of improvement. And they can identify ways to simplify or re-engineer the process.
Example "Current State" Process Diagram:
Example "Future State" Process Diagram:
Last updated